Note 👋 Live classes on Google Meet, offline coming soon!
Our Top Courses

Artificial Intelligence & Machine Learning
Original price was: ₹9,999.00.₹4,999.00Current price is: ₹4,999.00.

Mobile App Development using React Native
Original price was: ₹9,999.00.₹4,999.00Current price is: ₹4,999.00.

Mobile Application Development With Flutter
Original price was: ₹6,299.00.₹4,999.00Current price is: ₹4,999.00.


Skillfused. <br> Learn. Build. Transform.
0 Student
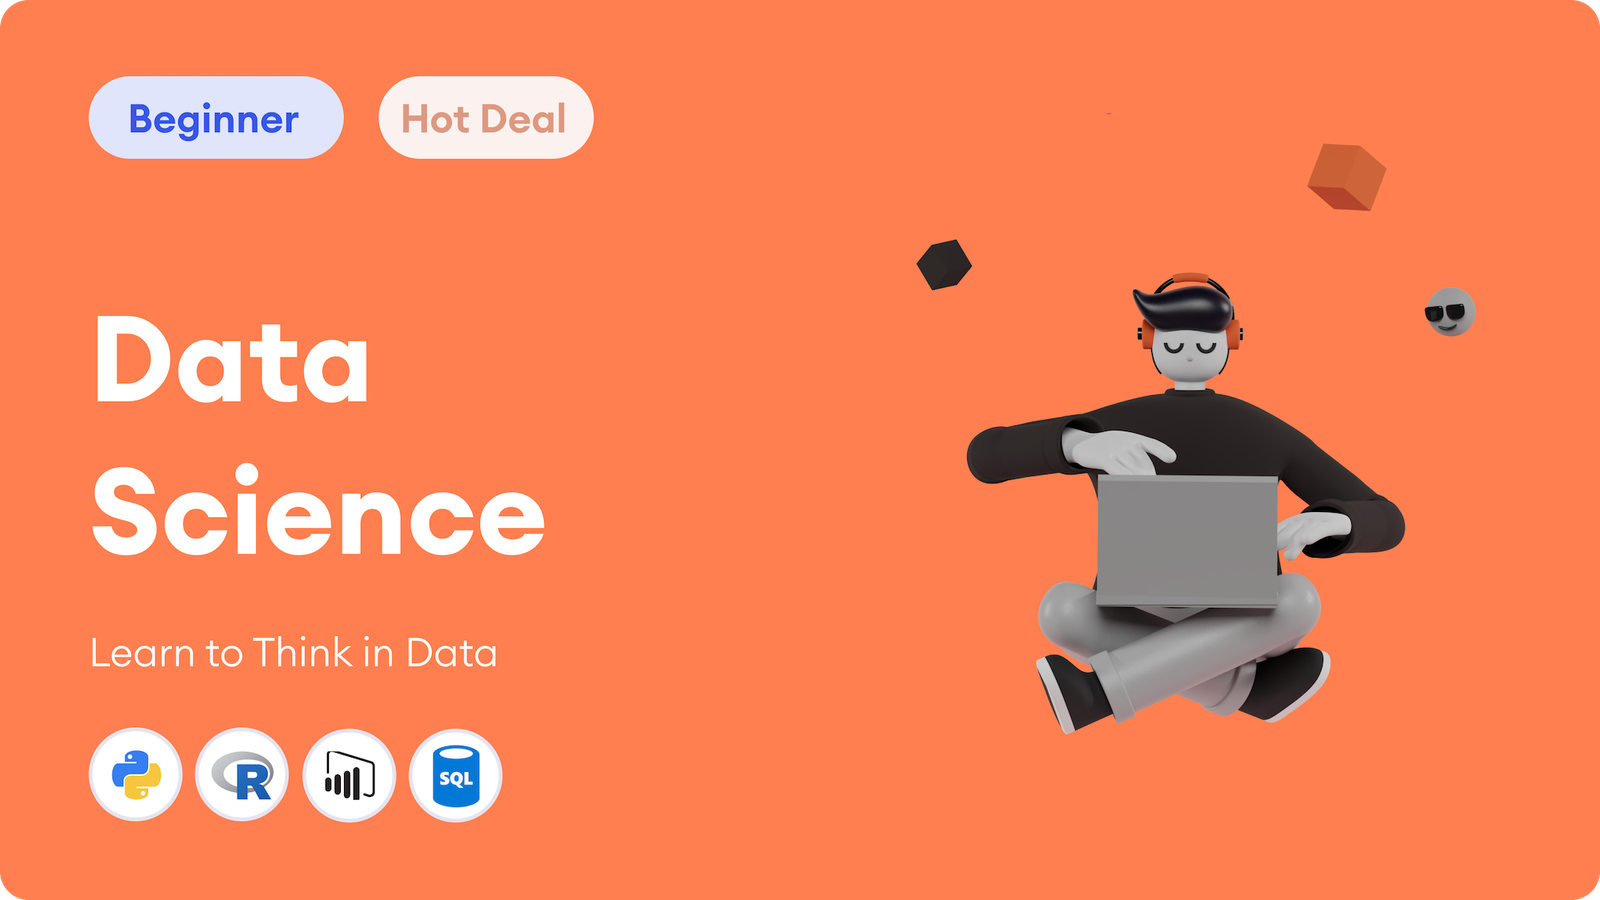
Data Science Foundations

About Course
The Data Science Foundations course is a beginner-friendly, hands-on program designed to introduce learners to the essential tools, techniques, and thinking patterns used in the world of data science. Using Python and real-world datasets, this course guides you through the full data science pipeline—from raw data to actionable insights—through clear, structured lessons and practical assignments.
You’ll start with core libraries like NumPy, pandas, and Matplotlib to explore, clean, and visualize data. As you progress, you’ll develop foundational statistical knowledge and apply machine learning algorithms like linear regression, k-nearest neighbors, and k-means clustering using scikit-learn. You’ll also dive into essential topics like feature scaling, model evaluation, and time-series analysis, giving you the skills to work with different types of data.
By the end of the course, you’ll create your own interactive dashboard using Streamlit, analyze a real-world dataset, and deliver a capstone project that demonstrates your ability to work through a complete data science workflow—from exploration to presentation.
This course is ideal for beginners in programming, aspiring data analysts, or professionals transitioning into data-related roles. No prior experience is required—just a passion for learning and problem-solving.
Benefits of the course
- Create and manipulate structured datasets using pandas DataFrames.
- Build predictive models with linear regression and classification algorithms.
- Visualize data trends and patterns using Matplotlib charts and plots.
- Clean, filter, and preprocess real-world data for accurate analysis.
- Apply train/test split and evaluation metrics to validate models effectively.
- Perform clustering using k-means to discover hidden patterns in data.
- Handle missing data, outliers, and inconsistent formats confidently.
- Build and deploy interactive dashboards using Streamlit.
- Explore and analyze time-series data with trend and seasonality awareness.
- Complete a real-world capstone project, from data cleaning to final presentation.
Course Content
-
Introduction to NumPy
-
Creating NumPy Arrays
-
Array Indexing and Slicing
-
Vectorized Operations
-
Broadcasting in NumPy
-
Aggregate Functions and Axis Parameter
-
Reshaping and Transposing Arrays
-
Logical Operations and Masking
-
Performance Comparison with Lists
Instructor
Skillfused is an emerging digital learning platform dedicated to empowering learners with industry-relevant IT skills. From beginner-friendly courses to advanced developer tracks, Skillfused offers hands-on, practical training across web development, mobile app development, data science, QA testing, and more. Each course is crafted by experienced professionals to ensure real-world application, job readiness, and learner success.
Original price was: ₹7,499.00.₹4,999.00Current price is: ₹4,999.00.
- Update:May 15, 2025
- Lectures147
- Skill LevelIntermediate
- LanguageTelugu, English
- Course Duration: 147h
Your Instructors
Skillfused
Course Creator
Skillfused is an emerging digital learning platform dedicated to empowering learners with industry-relevant IT skills. From beginner-friendly courses to advanced developer tracks, Skillfused offers hands-on, practical training across web development, mobile app development, data science, QA testing, and more. Each course is crafted by experienced professionals to ensure real-world application, job readiness, and learner success.
- 0 Courses
- 0 Reviews
- 0 Students
- 0 Courses
- 9 Reviews
- 0 Students
Requirements
- Complete each module in sequence for the best learning flow.
- Follow along with coding exercises using Jupyter Notebook or Google Colab.
- Use the provided datasets and notebooks—no need to search for data externally.
- Complete the mini assignments after each topic to reinforce your learning.
- Work on the capstone project using the open dataset of your choice.
- Submit your final project with a report and dashboard presentation.
- Ask questions in the course discussion forum or community chat for support.
Target Audience
- Beginners in Data Science looking to build a solid foundation using Python tools.
- Students from computer science, engineering, mathematics, or statistics backgrounds.
- Working professionals from non-tech domains aiming to switch to data-centric roles.
- Aspiring data analysts or data scientists preparing for entry-level roles or internships.
- Freelancers and entrepreneurs wanting to use data for decision-making and strategy.
- Developers or engineers looking to integrate data science into their software projects.
Show More
TOP COURSE
More Course By Skillfused
Artificial Intelligence & Machine Learning
This Artificial Intelligence & Machine Learning course provides a beginner-friendly yet…
Original price was: ₹9,999.00.₹4,999.00Current price is: ₹4,999.00.
Mobile App Development using React Native
This comprehensive course teaches you how to build cross-platform mobile…
Original price was: ₹9,999.00.₹4,999.00Current price is: ₹4,999.00.
Mobile Application Development With Flutter
This Flutter (Beginner) course provides a complete, hands-on introduction to…
Original price was: ₹6,299.00.₹4,999.00Current price is: ₹4,999.00.
Explore All Products
Related Course

Python Programming
This comprehensive Python programming course is designed to equip learners…
Original price was: ₹7,999.00.₹4,999.00Current price is: ₹4,999.00.
Data Science Foundations
Original price was: ₹7,499.00.₹4,999.00Current price is: ₹4,999.00.